|
Chart Tamer
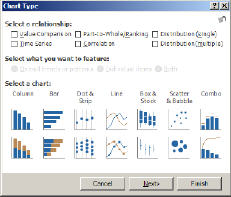
 Chart Tamer lets you create better Excel Charts, it aligns Excel's charts with the best practices of data visualization.
No other software comes close to Microsoft Excel in popularity for analyzing and presenting quantitative information.
The charts in Excel, which provide Excel's visual analysis and presentation functionality, however, are confusing,
inadequate, and sometimes poorly designed. In some respects this problem actually increased with the release of Excel
2007, because it did little for charts other than add superficial dazzle - visual effects that actually undermine a chart's
ability to display information effectively.
Chart Tamer tames Excel's charts, which seem to exhibit Microsoft's belief that "more is better", by bringing them into
line with the data presentation philosophy that "simple is better." We don't need more choices - we need a few good choices
that really work.
| Software Information |
System Requirements |
| Version: |
1.0 |
- Windows 8/7/XP/Vista
- SQL Server 2005/2008
- Microsoft NET framework 2.0
|
| License: | Free to try |
| File Size: |
3.41 MB |
| Screenshot: | View Screenshot
|
| Rating : |  |
Key Functions of Chart Tamer:
- It limits the list of available charts to the few that are most useful, thereby
reducing the complexity of choosing an appropriate chart
- It provides a simple new interface for selecting an appropriate chart, which guides us
to the right selection when help is needed without bogging us down when it’s not
- It adds three useful charts that aren’t currently available in Excel: dot plots, strip
plots, and box plots
- It revises the formatting defaults of Excel’s charts so that no extra work is necessary
to create charts that work effectively
- It provides colors for use in charts and elsewhere that were designed to work especially
for data presentation
- It allows us to quickly and easily improve old charts that were created prior to Chart
Tamer
RELATED SOFTWARE DOWNLOADS FOR CHART TAMER
- Chart Tools for Excel
With Chart Tools has never been so easy to handle Excel line charts.
- Spreadsheet Presenter
Easily customize charts and reports in Microsoft Excel for a more professional lookthat it converts
- MultiCharts Quarterly License
is a professional charting package that allows you to use thousands of existing TradeStation studies
- Custom GANTT Charts for Excel
is an Excel add-in program that allows you to Generate project style calendar plans, from a task list and associated details under YOUR OWN BRAND.
- Nevron Chart for .NET
is a professional data visualization component for WinForms and ASP.NET.
- Code Visual to Flowchart
is a source code flowcharting tool to help programmers understand and document source code.
- Edraw Flowchart ActiveX Control
Edraw Flowchart ActiveX Control is a MFC based ActiveX control.
- Mini Charts for Excel
helps you understand complex relationships in your data with sparklines. Sparklines are tiny charts with an intensity of visual distinctions.
|
|


 BestShareware.net. All rights reserved.
 Chart Tamer lets you create better Excel Charts, it aligns Excel's charts with the best practices of data visualization.
No other software comes close to Microsoft Excel in popularity for analyzing and presenting quantitative information.
