| Make BestShareware.net your home page | Add BestShareware.net to your favorites |
 Homepage |
 Help Desk |
 Site Map |
 |
 Popular |
 What's New |
 Featured |
| MAC Software | Linux Software | Pocket PC | iPod Software | Zune Software |
|
Mini Charts for Excel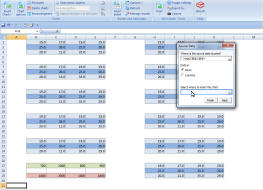 Mini Charts for Excel helps you understand complex relationships in your data with sparklines.
with Mini Charts you can use Sparklines, Heatmaps, Mini Charts and Bump charts, getting dramatically improved data visualization for fast and effective parallel comparisons. Mini Charts for Excel works with Excel personalization options. Because it has been created based on Excel native graphics, they can be personalized using all the styles and formats that Excel offers to enrich its presentation. As it´s been constructed over Excel´s own graphics, it is not necessary to install fonts or any additional requirements to be able to visualize the graphics and distribute them so you won´t have the disadvantage of waiting for the graphics to recalculate whenever the data is modified. You have four options for graphics. First you have the possibility of adding Sparklines resized to the size of a cell in order to make a fast analysis of your data. Second, you can insert heatmaps and icons in oder to analyze your data up to 5 dimensions, Third you also have Mini Charts that are optimized size graphics that allow a suitable representation of greater amounts of data for dashboards, Fourth see changes in your data immediately with bump charts.
Highlights of Mini Charts for Excel:
|
||||||||||||||||


|
Submit Software |
Privacy Policy |
Terms of Use |
Advertise with Us |
Contact Us
Copyright ©  BestShareware.net. All rights reserved.
|