|
PortfolioTK
 "PortfolioTK lets you identify the strengths and weaknesses of your investment strategy"
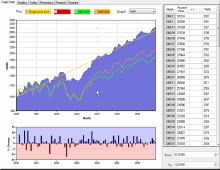
Portfolio Tool Kit provides an advantageous way of looking at your portfolio of investments.
Its clean and intuitive interface provides insight into how your overall portfolio is really performing,
through both accurate quantitative statistics and advanced charting. Not only that but you can use PortfolioTK's
reporting features to see how your portfolio has been performing against the major benchmark indices.
Identify the strength and weaknesses of your investment strategy so necessary corrections can be made
to maximize future returns. The only action necessary to see all your portfolio level statistics is
to enter your month ending account balance that you receive from your broker's statement.
That's it! All the graphs and statistics are then automatically calculated and updated.
To view further statistics on the individual trade level, you are also able to enter your security positions
to access an additional tier of pertinent information.
| Software Information |
PortfolioTK System Requirements: |
| Version: | 1.27 |
- Windows® 98 or later
- Microsoft® .NET Framework v2.0
- 128MB of RAM (256MB recommended)
- 50MB of available hard-disk space
|
| File Size: | 10.1 MB |
| License: | Free to try, $49.00 to buy |
| Screenshot: | View Screenshot |
| Rating : |  |
PortfolioTK's Features:
- Monte Carlo Simulation: Run Monte
Carlo style trials to test for What-if case scenarios.
- Benchmark Comparison: Compare your performance, both graphically and
statistically, to the S&P 500, S&P 400, and S&P 600
- Accurate Reporting: Accuracy matters when it comes to investments.
Derivations and explanations are documented so you know what is being calculated.
- Profit/Loss: View graphically the percentage
profit and loss for each designated month.
- Quantitative Statistics: Automatically
calculate pertinent statistics how portfolio is performing.
- Research: Use the built-in charting and
fundamental link to quickly see data on a company.
- Easy to Use: Everything is displayed
intuitively so no time is wasted trying to understand why something
is acting the way it is. It just works!
- VAMI Equity Curve: View the growth
consistency of your portfolio's equity curve without distorted results
from account deposits and withdrawals.
- Amibroker Import: Import your trade list
from Amibroker's Automatic Analysis so you can perform Monte Carlo
Simulations on your backtested results.
- Performance Graphing: View graphs that let you see the robustness of your strategy.
RELATED SOFTWARE DOWNLOADS FOR PORTFOLIOTK*
- Portfolio Optimization
The Portfolio Optimization template calculates the optimal capital weightings for a basket of investments that gives the highest return for the least risk
- XL Fusion 3.0.4
is used for merging several electronic worksheets into one worksheet automatically
- CuteTrader - Portfolio Builder/Analyzer
CuteTrader - Portfolio Builder/Analyzer:Diversify your portfolio globally and trade only the leading sectors..
- SmartFolio Professional Edition
Effective portfolio management tool that will provide asset allocation, portfolio optimization and risk management..
- StockFusion Studio
is market scan and portfolio optimization software with enterprise database connectivity
- Investment and Business Valuation
The Investment and Business Valuation software is ideal for evaluating a wide range of investment and business valuation scenarios
- TradeTrakker
is a powerful financial portfolio management application will help you monitor and analyze your stock.
- Smart Investor's Calculator for Windows
helps users to find optimal investment portfolios through solving allocation problems with the selected criterion
- StockQuoter
is your Portfolio Manager and Downloader for historical, end of day and intraday Quotes.
- Portfolio Tracking & Monitoring
The Portfolio Performance Monitoring template enables the ongoing monitoring and periodic valuation of a portfolio of investments.
- TradeTrakker
is a powerful financial portfolio management application will help you monitor and analyze your stock.
|
|


 "PortfolioTK lets you identify the strengths and weaknesses of your investment strategy"
 BestShareware.net. All rights reserved.


